Thank you for using Argos Junior. Here are a few pieces of information that, we hope,
can get you up and running efficiently with our system.
Note that we advise you to have Argos Junior running as you read this Quick Start to try some actions for yourself.
By the time you have read this page, you will most likely have seen the Primary Console, Scenegraph, and Paint Palette windows on your screen. Their appearances may be slightly different from the images displayed below if a different GTK theme is used on your computer (if you are a Windows user, see here for how to choose which GTK theme is used).
A few notes on these 3 windows:
- Primary console:
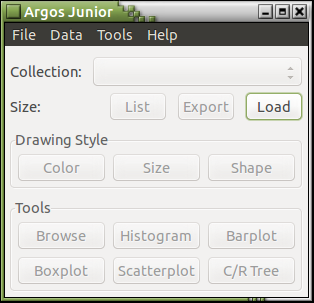
Argos Junior primary console - Right after you launch the system, the only usable button in the primary console is the button. Other buttons are grayed out and insensitive and will be usable only after a data set is loaded.
- One of the ways to load data is to click the button. The system will pop up a file selector from which you can load CSV, CSW, and several other types of data files. See here for details.
- There are more tools than that which meet your eyes. If tools you frequently use are not on the tool buttons, you can add them by yourself. Try right-clicking a tool button and see what happens. See here for details.
- More information on the primary console is available here.
- Scenegraph:
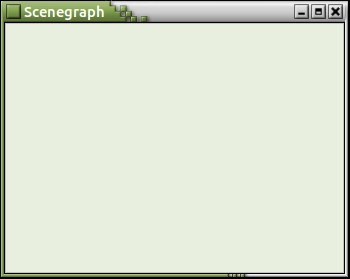
Scenegraph
When the system is launched, the Scenegraph is initially an empty window. During system use, this window displays a tree structure of all loaded datasets and any plots and dialogs derived from them. Each node in the tree structure has a right-click menu. Click here for details. - Paint palette:
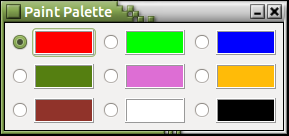
Paint palette
The paint palette allows users to quickly switch colors for painting, which can make discoveries of relationships in your data quick and easy and is an important step in our efficient LIPS-loop style of data analysis.
- Primary console:
If this is the first time you use Argos Junior, we recommend you to use the button to look at your data. Any number of variables can be selected in the menu popped up by , after which will proceed to generate the appropriate plots for all pairwise combinations of the selected variables.
To get more control over what type of plots to draw and how to draw them (such as creating a trellis of certain plots), invoke a specific plotting tool directly from the drop-down menu or click the corresponding button on the primary console.
Each plot has a set of modes, represented by icons in a row above a plot
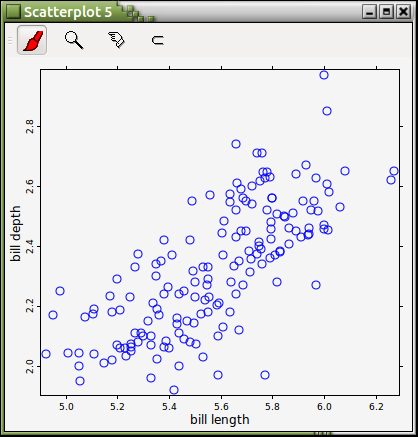
4 modes: Paint, logical zoom, identify, and data retrieval
and a right-click menu. Different types of plots have different sets of modes.A mode consists of tools for a particular job. One of these tools (the mode function) is invoked with the left mouse button and the rest (supporting functions) through the right-click menu.
Different mode functions are used differently with the left mouse button. Examples are:
- Paint mode: Left-click to paint a spot or left-click and drag the mouse around to paint a path.
- Data retrieval mode: Simply left-click to separate (or retrieve) data of a certain color for further analysis.
For details on a particular mode, do Shift + F1 (press the F1 key while the Shift key is held down) first and left-click the tool icon you are interested in.
The right-click menu displays the supporting functions of the current mode and functions nicknamed "housekeepers". The two groups of functions are separated by a horizontal line with the supporting functions above the line. Supporting functions are mode-specific functions while housekeepers are functions applicable to the plot no matter what mode a plot is in. Examples of right-click menus are:
Please note that the appearances of right-click menus depend on the GTK theme used.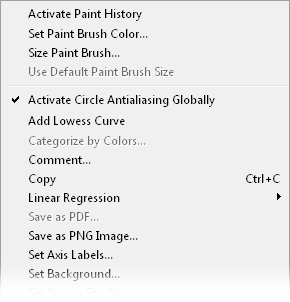
Right-click menu (paint mode) 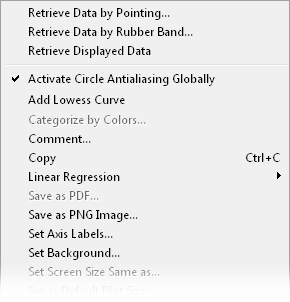
Right-click menu (data retrieval mode) - Even analytical tools present their results as plots with
numerical results readily available.
- Plots form a unique, live user interface to data being explored;
you can issue commands through one plot and see their results through many plots.
In general, you:
- Launch a tool to generate a plot,
- Inspect that plot for interesting patterns,
- Paint the observations behind the patterns interesting to you,
- Siphon the painted observations out and
- Loop back to launching a tool to examine the selected observations in whatever way you deem fit.
- You can automatically record your data analysis into a computer script
that can play back your original analysis (for records)
or redo your analysis on other datasets
with our graphical auditing facility. As graphical auditing records your data-analysis actions,
it is very lightweight (your computer will run as fast as usual),
and it can save you time and energy by taking care of
the repetitive clicking associated with routine data-analysis for you.
- Last but not least, the whole user's manual is here. For information on getting help while using Argos Junior see here.